Rank Feeling
League ranks are supposed to express objectivity. First place is better than second place, finishing 12th better than 13th. In this objective view, the value of ranks stays constant over time. 12th place in 2020 should be better than 13th in 1920.
Alas, fans are anything but objective. In their subjective mind, the value of league ranks depends on context. 13th in 1920 was perhaps a lot harder and a greater achievement, considering the club’s historical context, than 12th in 2020. Second place after throwing away a lead in the title race feels more depressing than climbing to third after a dismal season.
Arsenal reached the First Division in 1904/05. After 10th and 12th place, they finished 7th in their third season; for the first time in the top half of the table. At the time, 7th was a proud result for the young club from Woolwich. Fast forward to 2018/19, when 6th place felt like a disappointment. Subjectively, 6th in 2019 was worse than 7th in 1907.
In 2015/16 the Gunners finished second, one of the best standings in the club’s long history. After all, objectively, only 13 title-winning seasons were better. However, beaten to the title by the Miracle of Leicester, 2016 felt like a defeat for Arsenal and Arsène Wenger.
Liverpool completed successful seasons in 2002, 2009, 2014 and 2019, each time finishing second. Measured against the long wait since 1990 for another title, many fans still did not feel happy. Until 2020 it happened, finally.
Fans, pundits, players and club bosses judge league ranks based on subjective emotions and historical contexts, obstructing comparison across time.
And yet… Despite the difficulty, I hope to tease out some objective, or at least less subjective, analytical patterns.
The first challenge is the stark fluctuation in seasonal results. Chart 1 below shows Arsenal’s league rank history since 1904/05 with one dot for each season. Look at the chaos!
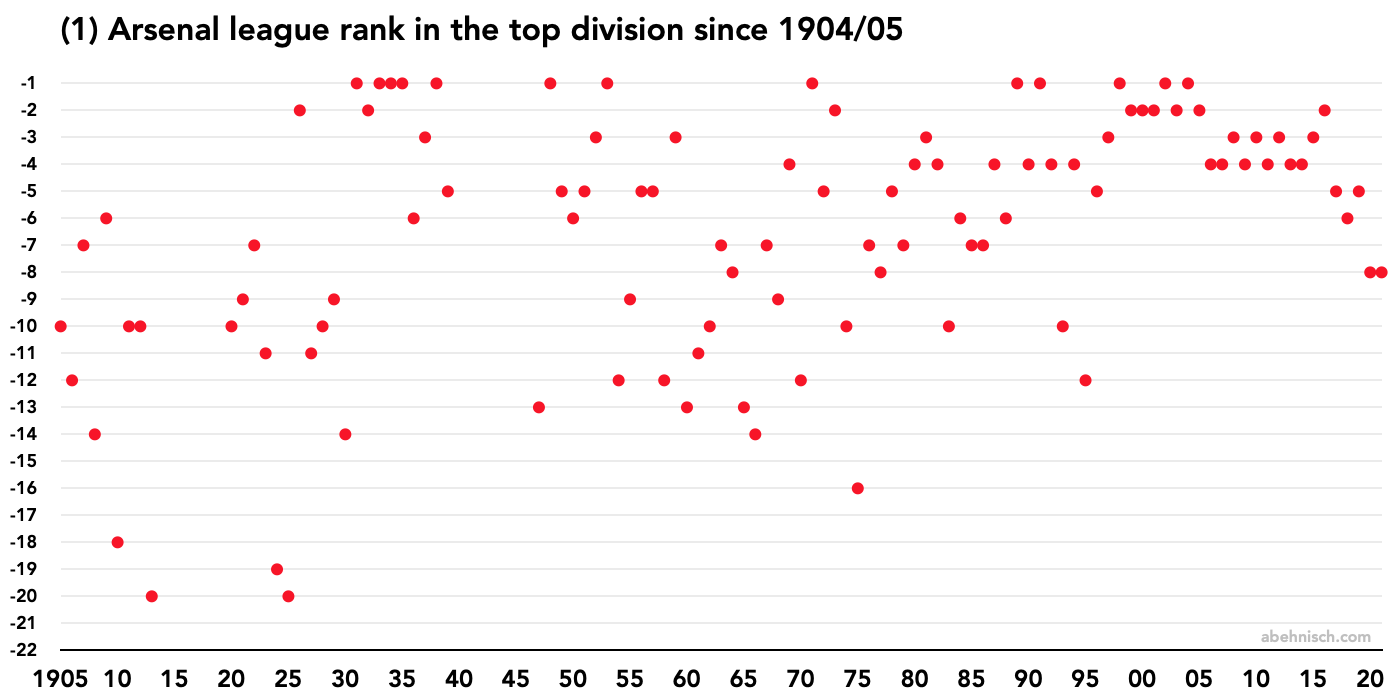
Season positions vary widely. Few trends catch the naked eye — except for 1997 to 2016, when Arsène Wenger provided extraordinary consistency.
Connecting the dots with a line helps, but not much, as illustrated in chart 2. Setting the Wenger era aside, the line jumps up and down. The breaks from 1914 to 1919 and from 1940 to 1946 are due to the calamity of war.
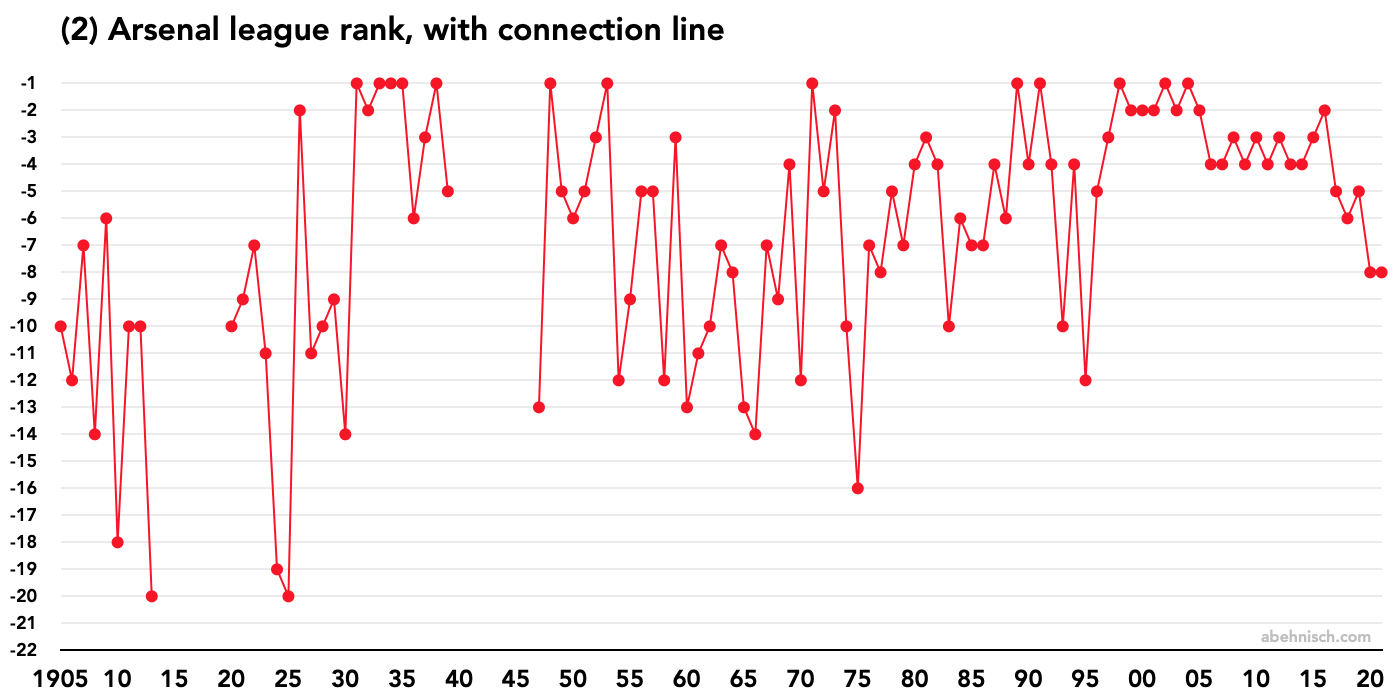
It can get worse. That jumpy-looking Arsenal chart represents one of the calmest, most stable clubs in English football. Arsenal have played at the top level since the post-war restart in 1919/20. Before, the Gunners had spent only two seasons in the second division. In effect, except for those two years, Arsenal have been a steady top division club since gaining promotion in 1904/05.
Compare Arsenal’s history with Fulham, neighbours in London and once also owned by the property developer and politician Henry Norris (1856-1934).
To illustrate Fulham’s even wilder swings across divisions, chart 3 uses continuous league ranks. If the first division has 20 teams, then 1st place in the second division counts as 21st place across all divisions.
CHART 3
Fulham’s trends: Coming here
Big shifts follow patterns in financial status and club management. Short-term jumps from season to season, however, often occur when competitive balance meets random luck.
If teams in a league are evenly balanced in strength, small differences can have a great impact. These small variations can be in performance, or the effect of luck and randomness. If teams in 6th and 14th are roughly of equal strength, merely separated by random luck, then next season their fortunes might be reversed.
Before the arrival of big money, from the 1950s to the 1980s, England’s league system enjoyed a healthy competitive balance between clubs. Relative equality paired with randomness made the league table look different each year. Big swings in league ranks were the consequence.
Today, inequality limits the upward mobility of lower clubs and reduces the downward trend for the rich elite. Arsenal, Chelsea, Liverpool and Manchester United have all experienced periods of bad management at some point in recent years. But no matter how bad things go, the rich cannot fall to the bottom of the table. Leicester 2016 is the one exception to the rule that smaller clubs cannot break into the top.
Psychology teaches us that humans are bad at accepting luck and randomness. We habitually deny, or at least downplay, this inconvenient truth. To recap: Randomness means fluctuation or variance over time. Sport calls it ‘form’. Luck refers to external events beyond one’s control. Referee errors are one example. Fans and pundits struggle to acknowledge their importance in sport.
Over five to ten games, random luck plays a crucial role. Over thirty to fifty matches, or at least one full season, external variance still matters. Only after 100 or 200 rounds, about three to five seasons, random luck diminishes to a minor nuisance.
The first task, for a more objective analysis, is to get rid of this short-term fluctuation. For a longer view, seasons can be combined using a moving average; let’s say, over three or ten years.
Woolwich Arsenal finished 10th in 1905, 12th in 1906, and 7th in 1907, which means a 3-season moving average of 9.7 for 1907. The table below explains how to calculate moving averages.
| Rank | 3-season average | |
|---|---|---|
| 1905 | 10 | |
| 1906 | 12 | |
| 1907 | 7 | (10+12+7)÷3 = 9.7 |
| 1908 | 14 | (12+7+14)÷3 = 11.0 |
| 1909 | 6 | (7+14+6)÷3 = 9.0 |
| 1910 | 18 | (14+6+18)÷3 = 12.7 |
Recall chart 1 and the chaos of single season points. Chart 4 now adds a trend line, showing the 3-season moving average.
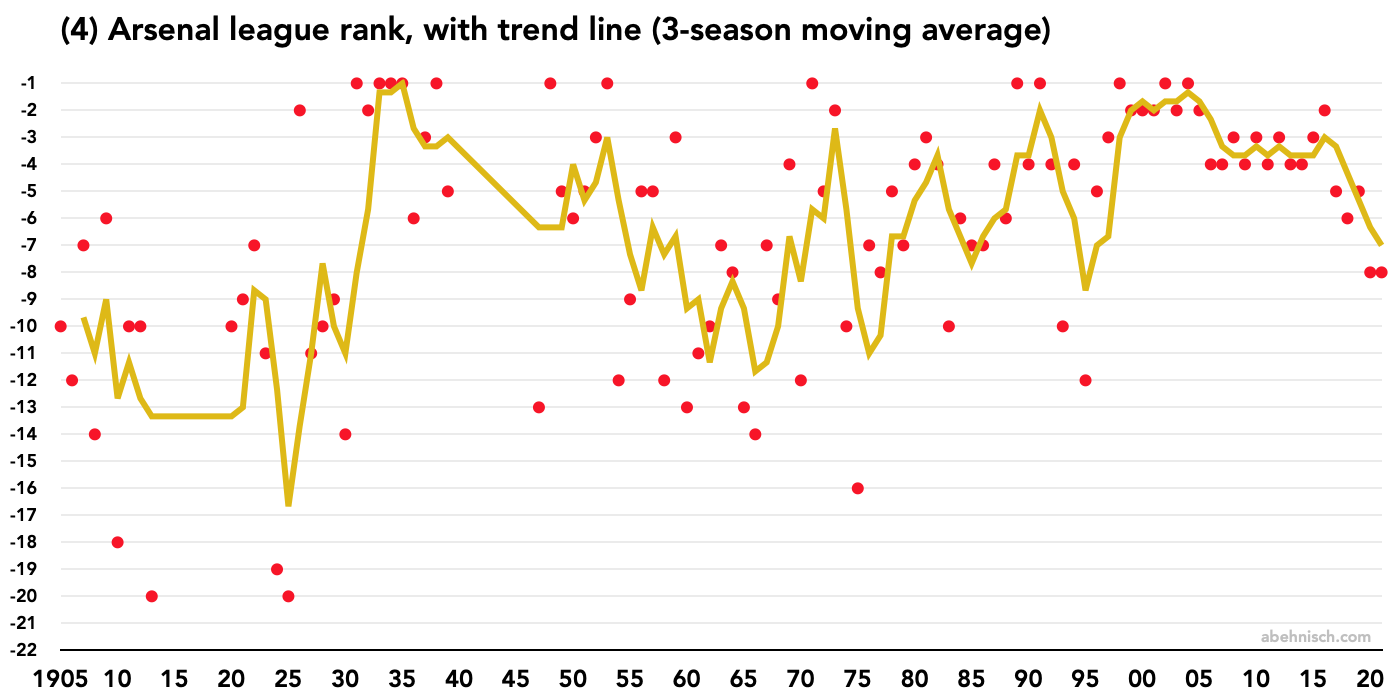
Notice how much smoother the line looks. Trend lines filter out the short-term noise and offer a stronger signal of what matters.
When the average increases from three to ten seasons, the long-term trends emerge even clearer.
Depending on the time span, every average tells its own story of rise and fall or stagnation. None tell the absolute truth. The art lies in the interpretation of the data.
A proposal
As noted, people value each season’s rank based on the context of that individual season. For example, 7th in 1907 might have felt better than 6th in 2019. Many factors influence that context, but the two most important are previous results and current money inputs.
Everyone knows about the tight relationship between long-term football success and money spent on player wages and transfer fees. When the biggest-spending club in the country finishes 3rd, fans regard it as a relative failure. A less wealthy club, meanwhile, would celebrate 4th place.
The issue of money must wait for another day. Here I focus on the other indicator of relative context: previous results.
Imagine you had to predict the league table for next season’s Chestball Premiership. You have no clue about chestball. You have never heard of Red Star Islington or Salford Wanderers. What do you do?
A simple way to guess the future is to use the past as a guideline. Without further information available, you bet that the 2022 season will resemble the 2021 season. Even better, to cancel out short-term noise, you can calculate the 3-season average. Hopefully, the average ranks of 2019, 2020 and 2021 will be a useful guide for the 2022 season.
This is the basic idea of my proposal to establish a time-sensitive context by taking the preceding trend line as a proxy for subjective expectation.
For example: In the last 3 seasons, your club finished 4th, 5th and 6th, which on average makes 5th place. If your club ends the next season on 3rd, that would be seen positively. Whereas 7th would be regarded negatively.
Now change the previous trend. In the last 3 years, your club ranked 6th, 8th and 10th, or on average 8th. In this case, finishing the next season 7th would be seen as a minimal improvement or stagnation.
| Rank | 3-season trend | Trend minus Rank | |
|---|---|---|---|
| 2019 | 4 | ||
| 2020 | 5 | ||
| 2021 | 6 | 5 | |
| 2022 | 7 | 5−7 = −2 |
| Rank | 3-season trend | Trend minus Rank | |
|---|---|---|---|
| 2019 | 6 | ||
| 2020 | 8 | ||
| 2021 | 10 | 8 | |
| 2022 | 7 | 8−7 = +1 |
In effect, we consider two ranks. The absolute, objective rank across all time. And the relative, subjective rank feeling measured by the difference to the prior trend line.
Enough theory! Let’s see how this works out for the Gunners.
Remember charts 1 and 4, first showing Arsenal’s history as season points and then adding a 3-season moving average trend line.
Now I add a third dimension: the difference between season points (depicted in chart 1) and the previous 3-season average (chart 4). This difference, shown in chart 6, I call the relative or subjective rank feeling. Negative numbers indicate a disappointment, positive numbers suggest expectations exceeded.
CHART 6: